Guide
Instagram Story Insights: How to Read Them
by igtrackr · Published 2026-05-27 · Updated 2026-10-09
Story Insights are simpler than feed-post Insights but easier to misread. This guide covers where they actually live, what each metric measures, and the under-loved signal that tells you whether your Story is holding or losing the room.
TL;DR
Instagram Story Insights live in the app's Story archive and in Meta Business Suite, for your own account, for 14 days after posting. You can see reach, impressions, taps forward / back / next / exits, replies, and shares. Taps-forward minus taps-back is the underrated metric — it tells you whether the audience kept engaging or kept skipping.
Where to find Story Insights
Story Insights are only available on Business and Creator accounts. If your account is set to Personal, you won't see them. Assuming you've made the switch, there are two ways to reach Story data in the app.
The first way is through your profile's Insights tab. Open your profile, tap the three-line menu in the top-right corner, select Insights, then scroll down to the Content You Shared section. Tap Stories to see a list of recent Stories you've posted, each with their headline metrics. You can filter by date range and sort by any metric — reach, impressions, taps, exits.
The second way is through individual Story frames. If a Story is still active, swipe up on it to see the viewer list and basic metrics. For archived Stories, open your Story archive (profile → hamburger menu → Archive), find the Story you want, and tap the chart icon. This gives you the per-frame breakdown, which is more useful for multi-frame Stories where performance can vary significantly from frame to frame.
Meta Business Suite at business.facebook.com also shows Story data under the Insights section, with a wider date range selector and better export options than the app.
What each Story metric actually measures
Instagram reports several metrics for each Story. Here's what each one actually counts, without the vague descriptions Instagram sometimes uses in its own help docs.
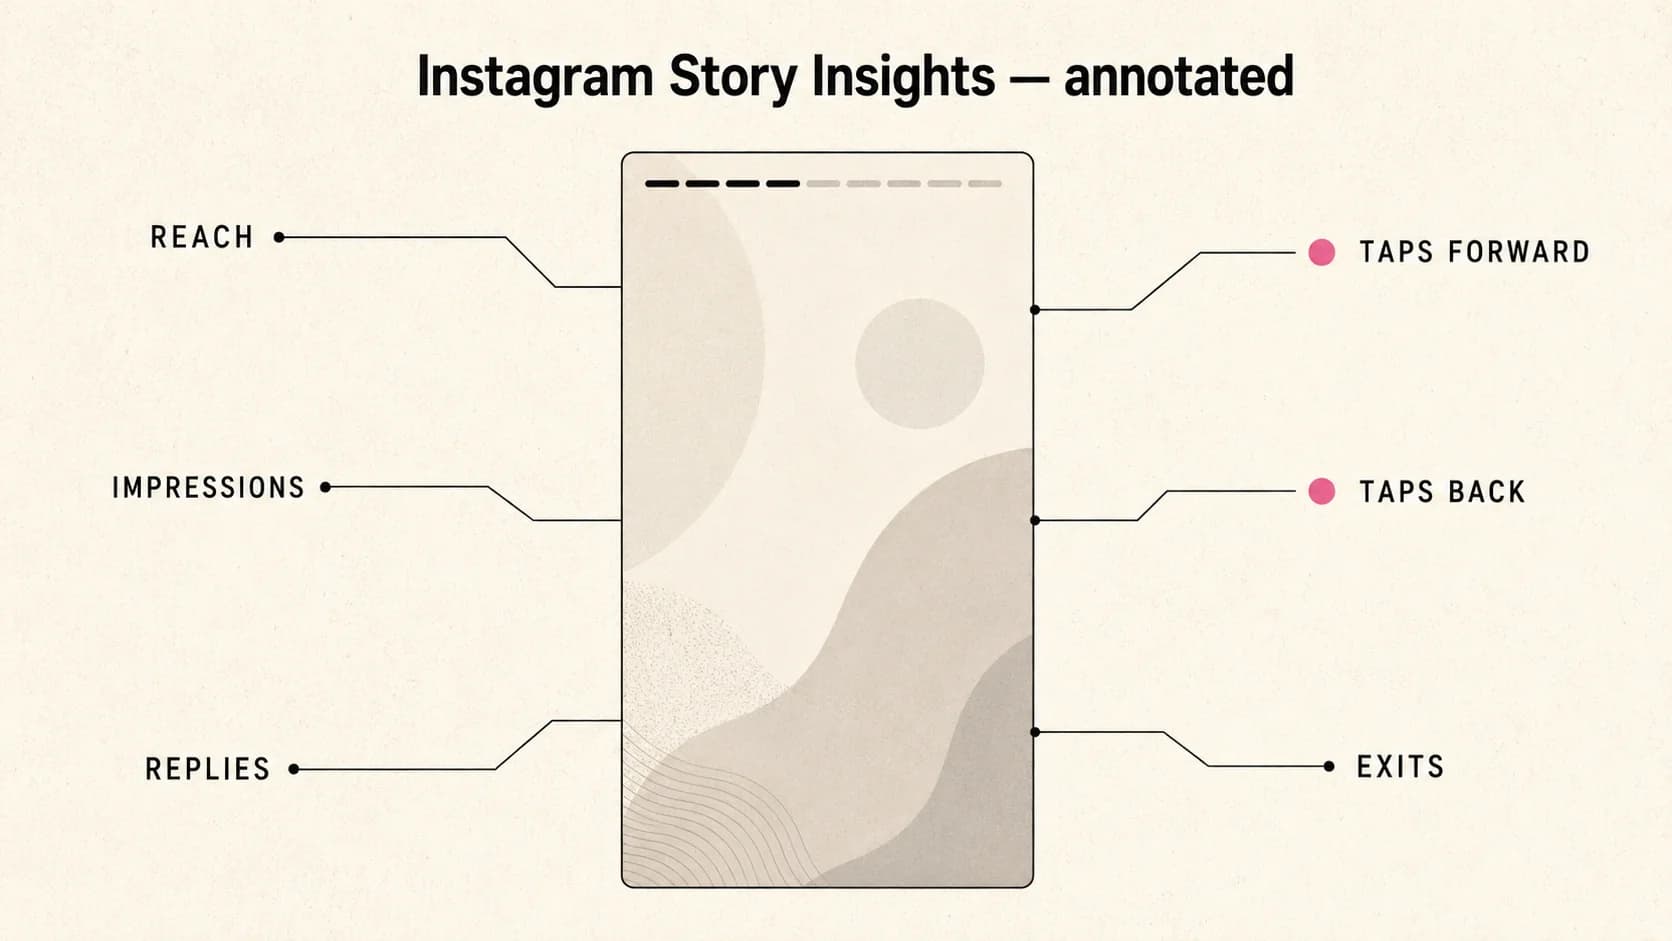
Reach is the number of unique accounts that saw your Story frame at least once. Impressions counts total views, including multiple views from the same account — so impressions will always be at least as high as reach, and often higher. Replies is how many direct message replies the Story prompted. Shares counts how many times the Story was forwarded to someone else via the share sheet. To put these numbers in context, see what a solid engagement rate benchmark looks like for your account size.
The tap metrics are the most Story-specific: Taps forward is the count of viewers who skipped to the next frame in your Story sequence. Taps back counts viewers who swiped back to replay the current or previous frame. Exits (sometimes shown as "swipe aways" or "navigation to next Story") is the number of viewers who left your Story entirely — either by closing Stories or by swiping to the next account's Story. Exits tell you where you lost the viewer, which is more actionable than just knowing your reach.
Public signals
Story Insights are private to the account owner. For any public account, igtrackr surfaces the public-data signals you can see — engagement rate, posting cadence, follower movement — without requiring a login.
Open the Profile Analyzer →The 14-day window (and how to keep history longer)
Story Insights are only available for 14 daysfrom the time the Story was posted. After that, Instagram removes the per-Story metrics from the app — they're gone, with no way to recover them through the native interface. This is one of the more frustrating data limitations in Instagram's Insights system, because Stories tend to be where the most raw audience signals live. For a broader map of what's available vs gated across Instagram's Insights, see our Insights Checker guide.
If you need to preserve Story performance data beyond 14 days, you have a few options. The most straightforward is a manual export: before the window closes, screenshot or record the key metrics — reach, exits, taps — for each Story frame you care about. It's tedious but reliable.
Meta Business Suite at business.facebook.com has a slightly longer memory for aggregate Story data and supports CSV exports. The export includes reach and impressions but may not break down taps and exits at the per-frame level. Still, it's the best non-manual option available.
If you run Stories at any volume, treating the 14-day window as a hard deadline for reviewing and recording performance data is a habit worth building. A simple spreadsheet — Story date, topic, reach, exit rate, reply count — is enough to track what's working over time without losing the historical thread.
Reading taps-forward vs taps-back
The taps-forward and taps-back metrics are the most informative signals in Story Insights, and the most underused. They tell you something that reach and impressions can't: whether viewers were engaged enough to slow down or whether they were trying to get past you.
A tap forward means the viewer didn't wait for the frame to auto-advance — they swiped forward manually. For most Story frames, a tap-forward rate above 20–25% of viewers is a sign that the frame didn't hold attention. Either the content wasn't interesting, the text was too dense to skim quickly, or the visual didn't signal value within the first half-second. High taps-forward on frame 1 of a multi-frame sequence is particularly important — if you lose them immediately, the rest of the Story's performance is moot.
Taps back is the inverse. Someone tapping back went out of their way to rewatch your frame, which requires more intent than passively watching. High taps-back suggests the content was interesting enough to revisit — a question they wanted to re-read, a visual detail they wanted a second look at, or an offer they wanted to catch again. Tracking taps-back per frame across your Stories over time is one of the cleaner ways to identify what content types resonate most with your audience, since it measures deliberate interest rather than passive exposure.
Taps-forward minus taps-back tells you whether the audience kept watching or kept skipping. It's a sharper signal than impressions — and almost nobody looks at it.
Why no third-party tool gives Story Insights for other accounts
Story Insights — reach, impressions, taps, exits, replies — are locked to the account owner by Meta's Graph API. The API does not provide Story performance data for accounts you don't own, and there is no legitimate workaround. This isn't a gap that a sufficiently sophisticated tool can close; it's an intentional access restriction at the platform level.
The reason is partly privacy — Story viewers don't necessarily want their viewing behavior aggregated and sold to third parties — and partly Meta's own commercial interest in keeping that data within its own advertising ecosystem. Whatever the reason, the result is the same: if you want Story Insights, they're only available for your own account.
Some tools claim to surface Story analytics for accounts you don't own. The honest question to ask is: where is this data coming from?If the tool cannot point to a legitimate API source, the data is either estimated (meaning invented) or scraped (meaning potentially unstable, inaccurate, and in violation of Instagram's terms). Neither is worth paying for. The better use of your time is to focus on your own Story analytics where the data is real, and use public-signal tools — what you can see for any public account — for competitive research. Our free tools surface the signals that are legitimately available without requiring account access.
Frequently asked
Quick answers
- How do I see Instagram Story Insights?
- Open the Instagram app, go to your profile, and tap the three-line menu in the top-right corner. Select Insights, then scroll down to the Content You Shared section and tap Stories. You can also open an archived Story directly — swipe up on any active Story or find it in your Story archive — and tap the chart icon to see metrics for that specific Story. You need a Business or Creator account for any of this to appear.
- How long do Story Insights stay available?
- Story Insights are available for 14 days from the time the Story was posted. After that, the metrics disappear from the Instagram app. Meta Business Suite can sometimes show aggregate Story data beyond 14 days, but per-Story breakdowns (reach, taps, exits) are only available within the 14-day window. If you want to keep the data, export it or record it before the window closes.
- Can I see Story Insights for someone else's account?
- No. Story Insights — reach, impressions, taps, exits, replies — are only accessible to the account owner. Meta's API does not expose these metrics for accounts you don't own. Any tool claiming to show you another account's Story taps or Story reach is not displaying real data.
- What's the difference between taps forward and taps back?
- A tap forward means the viewer swiped forward to advance past your Story frame — often a sign they weren't interested enough to watch it through. A tap back means they swiped backward to replay your frame — a sign of genuine interest or a desire to re-read something. High taps-back relative to views is a positive signal. High taps-forward relative to views suggests the content didn't hold attention.
- Why does my Story have more impressions than reach?
- Reach counts unique accounts that saw your Story. Impressions count total views, including repeat views from the same account. If someone opened your Story twice, that adds one to reach and two to impressions. A high impressions-to-reach ratio suggests some viewers are rewatching, which is generally a positive signal.
Keep reading