Guide
What's a Good Engagement Rate on Instagram?
by igtrackr · Published 2026-05-27 · Updated 2026-10-09
The 'what's a good engagement rate' question gets the same boilerplate answer everywhere — '3% is good'. The honest answer is that ER scales inversely with follower count, so the same 3% is exceptional for a 500K account and mediocre for a 5K one. Here are the brackets that actually apply.

TL;DR
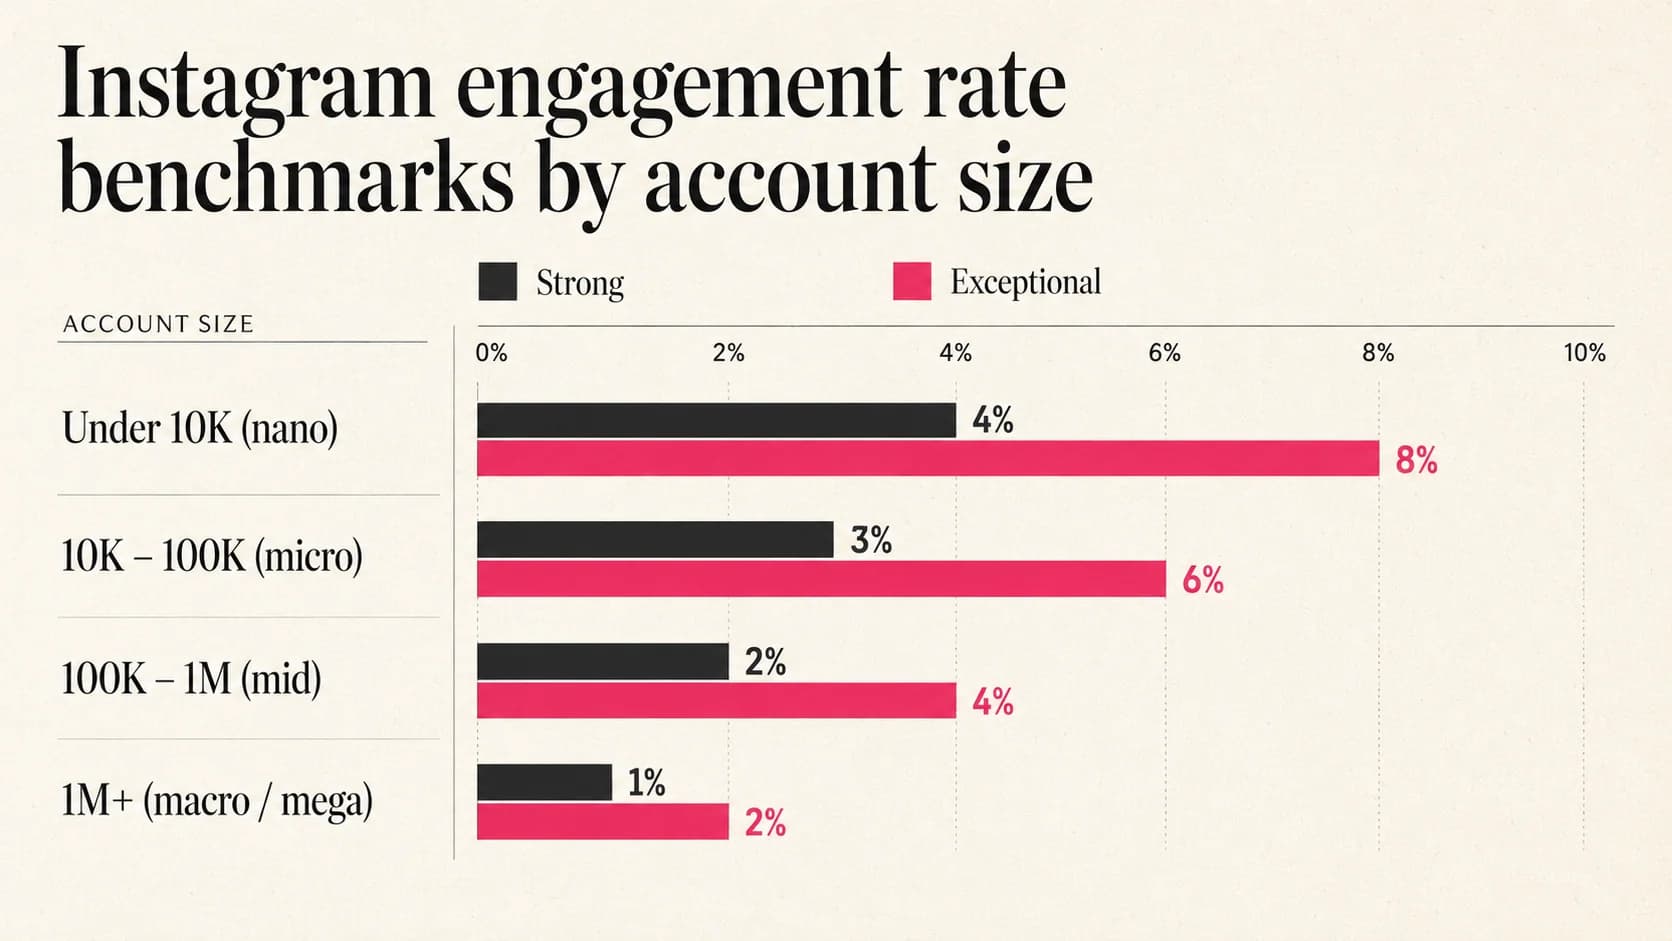
For Instagram accounts under 10K followers, 4% engagement is strong and 8%+ is exceptional. The thresholds drop as the account grows — by 1M+ followers, even 1% is solid. ER captures likes and comments but misses saves, shares, profile visits, and reach. Use it as one signal among several, not the whole story.
The formula and why it matters
The standard engagement rate formula is straightforward: take the total number of likes and comments on a post, divide by the account's follower count, and multiply by 100 to get a percentage. For a post with 200 likes and 15 comments on a 5,000-follower account, that's 215 ÷ 5000 × 100 = 4.3%. The quickest way to calculate ER for any public account is to let the calculator handle the math instantly.
The reason ER matters is that it normalizes raw engagement numbers against account size, making comparison possible. A post with 500 likes on a 10,000-follower account (5% ER) is outperforming a post with 1,000 likes on a 200,000-follower account (0.5% ER) by a significant margin, even though the raw like count is lower. Without the normalization, the comparison is meaningless.
Some tools and analysts include saves or shares in the numerator — sometimes called "true" or "extended" engagement rate. That version captures content people found worth saving or forwarding, which is arguably a higher-quality signal than a quick like. The tradeoff is comparability: saves and shares aren't available for accounts you don't own, so extended ER benchmarking requires same-tool data from your own account rather than broad peer comparisons.
Benchmarks by account size
These brackets are based on the likes + comments formula against follower count. Treat them as rough ranges — niche, content type, and posting frequency all shift individual accounts up or down from these norms. A highly specialized account in a tight niche tends to run above these benchmarks; a broad entertainment account often runs below. To analyze posts across your own account and spot patterns, the Profile Analyzer breaks down performance by content type and date range.
| Account size | Strong | Exceptional |
|---|---|---|
| Under 10K (nano) | ≥ 4% | ≥ 8% |
| 10K – 100K (micro) | ≥ 3% | ≥ 6% |
| 100K – 1M (mid) | ≥ 2% | ≥ 4% |
| 1M+ (macro / mega) | ≥ 1% | ≥ 2% |
Calculate yours
Enter any public Instagram handle to see its engagement rate benchmarked against accounts its size — no Instagram login.
Open the Engagement Calculator →Benchmarks by content type
The size brackets above assume an account's content mix is roughly typical. But content type itself moves the average. Carousels and Reels consistently outperform single-image posts by 1.5–2× because they capture more dwell time per impression — which the algorithm rewards with broader reach.
| Content type | Median ER | Strong |
|---|---|---|
| Carousel | ~1.5% | ≥ 3% |
| Reel | ~1.2% | ≥ 2.5% |
| Single image | ~0.7% | ≥ 1.5% |
| Story (per frame) | ~0.5% | ≥ 1% |
Source: Hootsuite + Sprout Social benchmark reports (2024–2025 cycle). Numbers move ~10–20% quarter over quarter — treat as directional, not literal.
Practically: if your account skews 80% single-image, expect lower aggregate ER than a peer who skews 50% carousel + 30% Reels. The fix isn't to chase the format; it's to know that your benchmark is content-mix-conditional.
Why ER drops as accounts grow
The decline in ER as accounts grow is structural, not a performance problem. When you have 1,000 followers and 80 people like your post, that's 8% ER. Those 80 people are likely a core group who found you early and follow closely. As the account grows to 50,000 followers, the 80 earliest fans are still there — but they're now a small fraction of a much larger denominator. If the new followers are less engaged on average (which is normal — they found you through a viral post or an algorithm recommendation, not by specifically seeking you out), the rate falls even if raw engagement numbers hold steady or grow.
There's also a feed saturation effect. Larger accounts have followers who follow more people in general, meaning more competition for attention in each person's feed. Smaller accounts tend to have tighter, more intentional audiences where each post is more likely to surface.
This is why the benchmarks table uses different thresholds per size bracket rather than one universal number. Holding a 3% ER at 500K followers requires genuine audience connection and consistently relevant content. Hitting the same 3% at 5K followers is a reasonable baseline expectation, not an achievement worth celebrating.
The same 3% engagement rate is exceptional for a 500K account and mediocre for a 5K one. Always benchmark against your size bracket — not the headline number.
What ER doesn't capture
The standard ER formula — (likes + comments) ÷ followers — misses several signals that are arguably more important. Saves indicate that someone found the content useful enough to return to, which is a much higher-intent action than a passive double-tap. Shares to Stories or DMs mean the viewer cared enough to redistribute it, which drives new reach. Neither saves nor shares are included in the basic formula.
Reach and impressions aren't captured either. A post could have an unremarkable ER but outstanding reach — meaning it got in front of many new people even if they didn't actively interact. Reels in particular tend to generate reach disproportionate to their like and comment counts because many viewers watch without engaging. Judging a Reel purely by its ER can be misleading.
Profile visits generated by a post, website link clicks, and direct message responses are also invisible to ER. For accounts that use Instagram to drive traffic or sales, these are the metrics that actually tie to business outcomes. ER tells you about relative audience connection — it doesn't tell you whether that connection converts to anything.
None of this means ER is useless. It's a reasonable, comparable proxy for content resonance. Just treat it as one data point, cross-reference it with saves and reach when you have access to those numbers — see what Instagram Insights actually surfaces vs. what requires third-party tools — and resist the urge to optimize only for likes and comments.
How to actually improve ER (without buying followers)
The most reliable way to improve engagement rate is to make content that earns it — which is less tautological than it sounds. ER drops when the content no longer matches what the existing audience came for. Before trying tactics, look at your top 10 posts by ER over the last 90 days and your bottom 10. The pattern between those two groups usually tells you more than any general advice.
On the practical side: carousels tend to generate more comments than single images because they invite completion and reaction. Questions in captions generate obvious comment spikes, but they have to be genuine questions — "what do you think?" tacked onto unrelated content doesn't work. Responding to every comment in the first hour after posting is one of the cleaner, research-supported ways to signal to the algorithm that your post is driving conversation.
What doesn't work: engagement pods (coordinated like-swapping rings), follow/unfollow cycles, or any tactic that inflates follower count without improving content relevance. These either degrade ER directly (more low-quality followers, lower rate) or are detectable by platforms and result in reduced distribution. Buying followers is the most direct way to hurt your own ER — inactive accounts in the denominator lower the rate immediately and permanently until they're purged. Tracking follower growth over time helps distinguish genuine audience expansion from inflated counts.
A realistic improvement timeline: if you make a genuine content shift — changing format, narrowing topic, improving production quality — you should see a measurable ER change within 30–60 days of consistent posting. Faster changes are usually a sign of an outlier post, not a sustainable shift.
Frequently asked
Quick answers
- What's the average engagement rate on Instagram?
- It depends heavily on account size, so a single 'average' is misleading. For nano accounts under 10K followers, an average ER in the 3–5% range is realistic. For accounts in the 100K–1M range, 1–2% is more typical. The number that matters is whether your ER is above or below what similar accounts in your niche are earning.
- Is my engagement rate good for my follower size?
- Use the size brackets in this guide as a rough benchmark. If you're a 15K account posting consistently and landing above 3%, that's healthy. If you're well below the floor for your tier, the first questions to ask are whether your content mix has drifted from what built your audience, and whether there's a follower quality issue from past growth tactics.
- How do I calculate engagement rate?
- The standard formula is (likes + comments) ÷ follower count × 100. Some variants add saves or shares to the numerator — those versions tend to tell a more complete story of content value, but they're less comparable across tools since most publicly-accessible data doesn't include saves. For benchmarking purposes, stick to the likes + comments version for apples-to-apples comparisons.
- Why is my engagement rate dropping even though my followers are growing?
- This is the normal, expected behavior — not a sign something is broken. As your follower count grows, a fixed pool of engaged fans becomes a smaller share of the total. If 500 people reliably engage with your posts and you had 10K followers, that's 5%. After growing to 25K followers, the same 500 engaged people is only 2%. The absolute engagement may be holding fine while the rate falls.
- Does buying followers help my engagement rate?
- No — it makes it worse. Bought followers are inactive accounts, so they inflate your denominator without adding any likes or comments. A 10K account with 3K bought followers has the same engagement numbers as before but now shows a lower ER. It also damages the credibility signal ER is supposed to provide to brands, collaborators, and the algorithm.
Keep reading